


- Data-Augmented Machine Learning for In Vitro Starch Digestibility Prediction and SHAP-Based Interpretation of Structure–Rheology Features
Yeonsong Nam*,#, Sehyeon Jin**,#, Yerin Hyun*, Cheng Li***, Ji Hun Park****, *****, ******, Jongbin Lim*, *******,†
 , and Yun Am Seo**,†
 *Department of Food Bioengineering, Jeju National University, Jeju 63243, Korea
**Department of Data Science, Jeju National University, Jeju-si, 63243, Korea
***Food & Nutritional Sciences Programme, School of Life Sciences, The Chinese University of Hong Kong, Shatin 999077, Hong Kong
****Department of Science Education, Ewha Womans University, Seoul 03760, Korea
*****Institute for Multiscale Matter and Systems, Ewha Womans University, Seoul 03760, Korea
******Ecogear Inc. Jeju Factory, Jeju 63359, Korea
*******Interdisciplinary Graduate Program in Advance Convergence Technology and Science, Jeju National University, Jeju 63243, Korea- 데이터 증강 기반 기계학습을 이용한 전분의 In Vitro 소화율 예측과 구조–레올로지 특성의 SHAP 기반 중요도 해석
남연송*,# · 진세현**,# · 현예린* · Cheng Li*** · 박지훈****, *****, ****** · 임종빈*, *******,†
· 서윤암**,† Reproduction, stored in a retrieval system, or transmitted in any form of any part of this publication is permitted only by written permission from the Polymer Society of Korea.
Starch is a polysaccharide biopolymer whose structure–rheology relationships influence its functional behavior, including in vitro digestibility; however, small datasets often limit the accuracy of quantitative predictions. Here, the in vitro digestibility (0–1) of ten starch samples was modeled using molecular features (A- and B1-chain fractions and amylose content) and pasting/rheological features. Four tabular data-augmentation methods (FastML preset, Gaussian copula, tabular variational autoencoder, and conditional tabular generative adversarial network) were benchmarked using quality metrics, and the optimal approach generated 200 synthetic samples for model training. random forest, support vector regression, XGBoost, lightGBM, and neural network were optimized through grid search. Among these, the neural network demonstrated the best predictive performance (R2 = 0.907). SHAP (Shapley Additive Explanations) analysis was then applied to interpret the trained model, identifying consistency index, setback viscosity, and peak viscosity as dominant contributors, highlighting the roles of gel strength and viscosity recovery. This framework offers a data-driven tool for the rapid screening and design of starch-based materials through small-sample experiments.
전분은 대표적인 다당류 바이오폴리머로서 구조–레올로지 관계가 기능적 거동, 특히 in vitro 소화 특성에 영향을 미치지만, 제한된 데이터로 인해 정량적 예측이 어렵다. 본 연구에서는 10종 전분의 in vitro 소화율(0–1)을 A- 및 B1-사슬 분율, 아밀로스 함량 등 분자적 특성과 페이스팅/레올로지 특성을 이용하여 전분 소화율을 예측하는 기계학습 모델을 개발하였다. FastML preset, Gaussian copula, tabular variational autoencoder, and conditional tabular generative adversarial network의 4가지 데이터 증강 기법을 품질 지표로 비교한 뒤 최적 기법으로 200개의 합성 데이터를 생성하여 학습에 활용하였다. 5가지 기계학습 알고리즘(random forest, support vector regression, XGBoost, lightGBM, neural network)을 그리드 서치로 최적화한 결과 신경망 모델이 최고 성능(R2=0.907)을 보였다. 이후 shapley additive explanations(SHAP) 분석을 통해 consistency index, setback viscosity, peak viscosity가 주요 기여 인자로 확인되어, 겔 강도 및 점도 회복 특성이 소화 특성에 중요한 역할을 함을 시사한다. 본 프레임워크는 소표본 실험 환경에서 전분 기반 소재의 소화 특성 예측 및 선별, 그리고 설계 방향 제시에 활용될 수 있다.
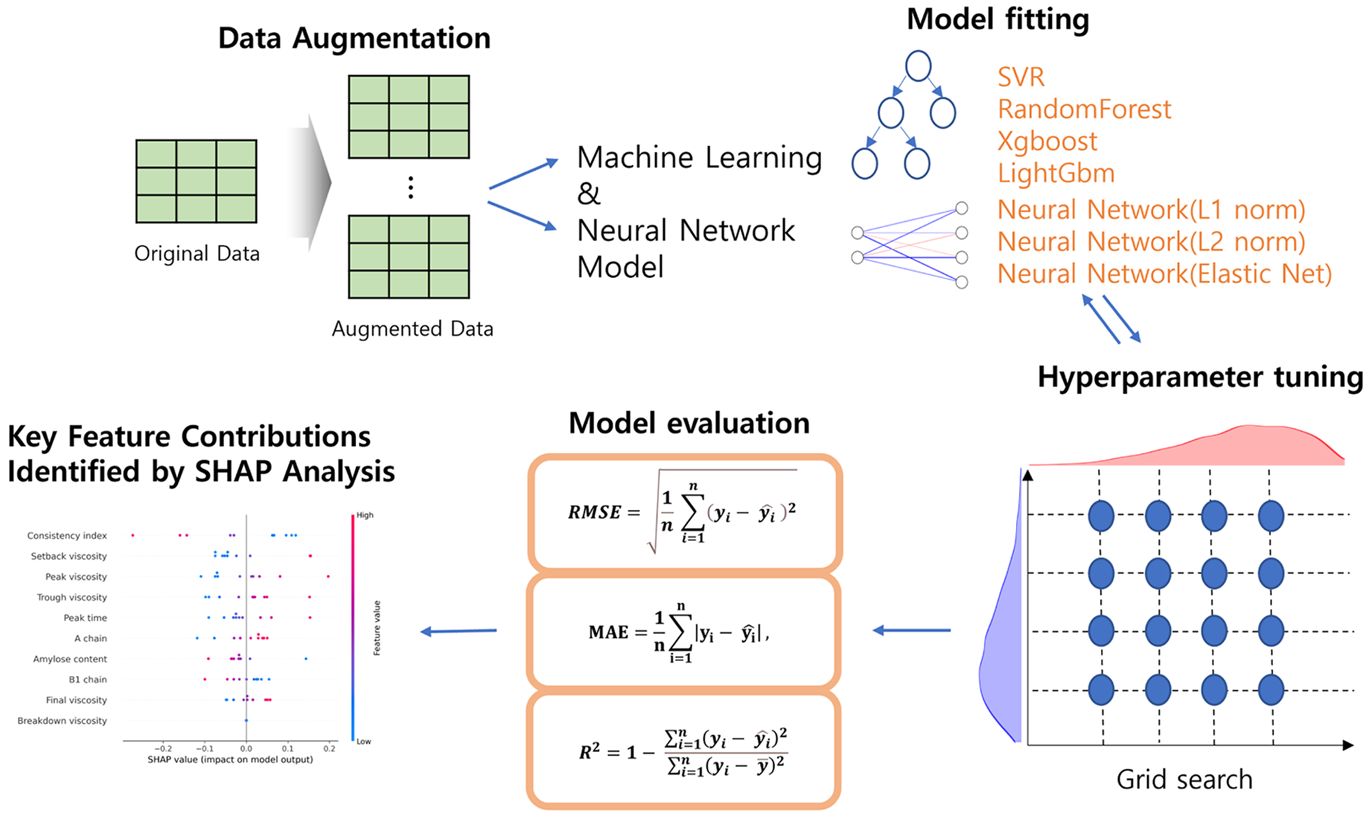
The workflow illustrates the machine learning model development process for starch digestibility prediction, which begins with data augmentation and proceeds through model training, hyperparameter optimization, model evaluation, and variable importance analysis using shapley additive explanations (SHAP). The original dataset is expanded through statistical modeling techniques. The augmented dataset was then used to train multiple machine-learning and neural network models-Random Forest, Support Vector Regression (SVR), XGBoost, LightGBM, and a neural network with different regularization methods (L1, L2, and Elastic Net). Each model undergoes hyperparameter optimization via grid search. The optimized models are evaluated using performance metrics (RMSE, MAE, and R2). Finally, SHAP analysis is applied to identify and quantify the contributions of various rheological and structural properties to starch digestibility prediction.
Keywords: starch biopolymer, starch digestibility, data augmentation, machine learning, shapley additive explanations.
This research was supported by the Regional Innovation System & Education (RISE) program through the Jeju RISE center, funded by the Ministry of Education (MOE) and the Jeju Special Self-Governing Province, Republic of Korea (2025-RISE-17-001).
The authors declare that there is no conflict of interest
Starch is a primary source of carbohydrates for humans. During the process of digestion, it is broken down into glucose, which is then converted into energy.1 The digestibility of starch is determined by various factors, including structural characteristics, amylose content, molecular weight distribution, and viscosity properties.2,3 These factors are directly linked to blood glucose response.4 Accurate prediction of starch digestibility is imperative for the food industry, as it provides essential information for nutritional labeling, glycemic index management, and the development of functional foods.5
Conventionally, the assessment of starch digestibility has been conducted through in vitro digestion experiments.1,6 However, these experiments are time-consuming and costly, and they have limitations in systematically analyzing various types of starch. Recent advancements in machine learning techniques have prompted active research into the development of predictive models for food characteristics.7,8 However, due to the limited number of starch types that have been studied, most research relies on small sample sizes. Consequently, the generalizability of these models is constrained.9
The employment of data augmentation techniques has emerged as a critical strategy to circumvent the constraints imposed by machine learning models when analyzing small samples.10 In particular, synthetic data generation methods based on statistical modeling have the capacity to produce data that mimics the distribution of the original data while preserving the correlations between variables.11 The employment of data augmentation techniques, even with small samples, should enable the acquisition of reasonably generalized results in machine learning-based digestibility prediction modeling and influence factor analysis.
The objective of this study is to develop a machine learning model that predicts starch digestibility from small datasets (10 samples) and to identify key variables affecting digestibility. To this end, a comparative evaluation of various data augmentation techniques was conducted to select the most suitable one, which was then employed for statistical modeling-based data augmentation. In addition, a comparative analysis was conducted among various machine learning algorithms (Random Forest, SVR, XGBoost, LightGBM) and neural network models. Hyperparameter optimization was executed via grid search. Following the selection of the optimal model, SHAP (SHapley Additive exPlanations) analysis was employed to identify the key variables affecting digestibility.
Materials and Methods. The flowchart for this study is shown in Figure 1. The workflow illustrates the process of developing a machine learning model for starch digestibility prediction, beginning with data augmentation and progressing through model training, hyperparameter optimization, model evaluation, and variable importance analysis. The process commences with data augmentation, where the original small dataset is expanded using statistical modeling techniques. Following augmentation, the expanded dataset is utilized for training multiple machine learning and neural network models. Each model undergoes hyperparameter optimization through grid search. The optimized models are evaluated using performance metrics, including RMSE, MAE, and R2. Finally, the best-performing model is subjected to SHAP analysis to identify and quantify the contributions of various rheological and structural properties, revealing their relative importance in determining starch digestibility. The subsequent sections (2.2 through 2.5) provide a detailed exposition of each step.
Data Collection. The present study procured data regarding starch content from a total of ten samples, including wheat, rice, corn, arrowroot, potato, sweet potato, tapioca, chestnut, acorn, and mungbean. The independent variables for each starch sample are as follows: The chain (molecular chain length distribution), B1 chain (molecular chain length distribution), consistency index, and amylose content (percent) are the variables of focus. The dependent variables measured included Peak Viscosity, Trough Viscosity, Breakdown Viscosity, Final Viscosity, Setback Viscosity, and Peak Time. Digestibility (range 0-1) was measured as the dependent variable, determined through in vitro digestion experiments. All measurements were performed in accordance with standardized protocols, and the average value was calculated based on three replicate measurements for each sample. The raw data are presented in Table 1.
Data Augmentation. In this study, we implemented four models from the SDV (Synthetic Data Vault) Python library—CTGAN (Conditional Tabular Generative Adversarial Network), TVAE (Tabular Variational Autoencoder), Gaussian Copula, and FastML Preset—to generate synthetic data based on tabular experimental data11. Each model is designed to learn the distribution characteristics of the original data through various approaches, including generative neural networks, variational inference, statistical models, and automated preset-based methods. These models are then utilized to synthesize new samples while maintaining statistical consistency.
CTGAN is a tabular data synthesis model based on the CGAN (Conditional Generative Adversarial Network) architecture. TVAE uses the probabilistic generation structure of Variational Autoencoders (VAE) to process tabular data. This model encodes input data into a latent variable and then reconstructs
it to approximate the original data distribution. The Gaussian Copula model is a statistical approach to data synthesis. It estimates the marginal distribution of each variable and then uses a Gaussian copula to model the correlation structure between variables. FastML is an automated preset for generating synthetic data provided by the Synthetic Data Vault (SDV) framework. It efficiently learns the statistical structure of large-scale phenotypic data and rapidly reproduces it.12
For each technique, synthetic datasets were generated using the same original data, and their similarity to the original data was evaluated using SDV quality assessment metrics. The similarity evaluation measured: The “Column Shape Score” is a metric that quantifies the similarity between the distribution of each univariate variable and the original distribution. The “Column Pair Trends Score” is a metric that quantifies the similarity between the correlations between variable pairs and the correlations in the original data. The “Overall Quality Score” is a metric that balances the reflection of univariate distributions and the correlations between variable pairs. The data generated by the technique showing the highest similarity was used for model training, while the original data was used for testing.
To justify the augmentation size, an evaluation of the Overall Quality Score was conducted across augmentation sizes of 10, 25, 50, 100, 200, 300, and 500. The score demonstrated convergence beyond 200 samples (Figure 2). After a thorough evaluation of the quality and computational cost, it was determined that 200 would be the optimal augmentation size.
Machine Learning and Neural Network Models. The present study employed four machine learning models: The following algorithms were utilized: Random Forest, Support Vector Regression (SVR), XGBoost (Extreme Gradient Boosting), and LightGBM (Light Gradient Boosting Machine).12-15 A grid search was performed to optimize the hyperparameters across all models.
For Random Forest, the following parameters were explored: n_estimators (100, 200, 400), max_depth (None, 5, 10), and min_samples_leaf (1, 2, 4). For SVR, the following parameters were explored: C (0.1, 1, 10, 100), epsilon (0.01, 0.1, 0.5), kernel ('rbf', 'linear', 'poly'), and gamma ('scale', 'auto', 0.001, 0.01). In the context of XGBoost, the following parameters were explored: n_estimators (100, 200, 400), max_depth (3, 5, 7), learning_rate (0.01, 0.05, 0.1), subsample (0.6, 0.8, 1.0), and colsample_by_tree (0.6, 0.8, 1.0). For LightGBM, the number of variables was dynamically adjusted, and the following parameters were explored: n_estimators (100, 200), max_depth (3, 5), learning_rate (0.05, 0.1), num_leaves (15, 31), and subsample (0.6, 0.8).
The neural network model under consideration consists of an input layer, one hidden layer, and an output layer, with the ReLU activation function applied to the hidden layer. The models incorporating L1, L2, and Elastic Net regularization were comparatively analyzed and evaluated, while the model devoid of regularization was excluded from the analysis. Regularization is employed to prevent model overfitting.16 The standardization of both input and output variables was achieved through the implementation of the aforementioned formula, with the Adam optimizer utilized for this purpose. The learning rate was set at 0.001, and the weight decay was set at 0.0001. We investigated batch sizes of 8 and 16, as well as epochs of 200 and 400. Furthermore, the number of neurons in the hidden layer was investigated as 8, 16, and 32. The selection of optimal hyperparameters was achieved through the implementation of 4-fold cross-validation.
Model Evaluation. The data was split for model training and performance evaluation as follows. The SDV synthesizer (FAST ML preset) was trained to learn the probability distribution from the original 10 samples and subsequently generated synthetic data by sampling from this distribution. It should be noted that similar approaches have been employed by Gaussian Copula, TVAE, and CTGAN. Synthetic data consists of newly generated samples that exhibit a distribution similar to the original. The model was trained exclusively on 200 synthetic samples, with the original 10 samples excluded from the training process. Following the conclusion of the training phase, an evaluation of the model's performance was conducted. The original 10 samples were designated as the test set for this evaluation.
The performance of the model that was trained with augmented data was evaluated using the original data. The model that was selected through grid search was the one that was evaluated. The validation metrics employed for model evaluation included mean absolute error (MAE), root mean square error (RMSE), and coefficient of determination (R2), with the respective formulas listed below.
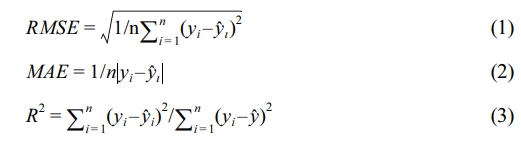
Feature Importance Analysis. A SHAP (SHapley Additive exPlanations) analysis was conducted to ascertain the importance and direction of influence of variables for the finally selected digestibility prediction model. SHAP is a method based on the concept of the Shapley value, a fundamental principle in game theory. This method is capable of fairly decomposing the contribution of all features.17,18 The contribution (Φi) of a feature is defined as follows.
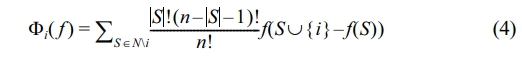
Here, denotes the Shapley value (contribution) of feature, and represents the entire feature set. p denotes the total number of features, denotes the subset of features excluding feature, denotes the size of the set (number of features), denotes the prediction value (or contribution) when only the feature set is used, and denotes the prediction value (or contribution) when feature is added to the feature set.
Chain Length Distribution of Starch. Starch was treated with pullulanase and isoamylase (Megazyme, IL, USA) in sodium acetate buffer (100 mM and pH 5.0) at 40℃ for 48 h. After enzymatic treatment, the solution was applied to a CarboPac PA-100 analytical column (4 × 250 mm, Dionex, USA) following a 0.45 µm nylon membrane filtration. An electrochemical detector (ED 40, Dionex, USA) was used. 120 mM sodium hydroxide and 600 mM sodium acetate in 120 mM sodium hydroxide at a flow rate of 1 mL/min. An elution gradient was made by mixing eluent B into A as follows: 0-10 min, 5-15% B; 10-120 min, 15-100% B. The result was analyzed by Chromelon & software (Dionex, USA), and the chain length distribution was calculated as a percentage of the total peak area.
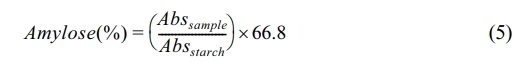
Amylose Content of Starch. The amount of amylose in starch was measured by using the Megazyme Kit (K-AMYL, USA). Starch was mixed with dimethyl sulfoxide (DMSO) and then placed into the boiling water bath for 15 min. After boiling, the solution was further mixed with 6 mL of 95% ethanol and centrifuged at 2,000 g for 5 min. The pellet was further mixed with 2 mL of DMSO and transferred to the boiling water for 15 min. After ethanol rinsing, 0.1 mL of amyloglucosidase and α-amylase enzyme mixture was added to the solution and incubated at 40 ℃ for 30 min. Glucose Oxidase/Peroxidase solution was applied to measure the released glucose by reading the absorbance at 510 nm using a microplate reader (SpectraMax ID3, Molecular Devices, USA). The amylose content in starch was calculated using the following equation:
Rheological Property of Starch. The flow behavior of starch was investigated by using a controlled-stress rheometer (HR10, TA Instruments, USA) with a 40 mm parallel plate. The test solution (3%, w/w) was prepared by heating at 80 ℃ for 15 min. It was subjected to steady-shearing at 25 ℃, and the shear rates tested ranged from 1 to 500 s-1.
Pasting Property of Starch. The pasting property of starch was measured by using a rheometer equipped with a starch pasting cell (HR10, TA Instruments, USA). 3 g of starch in 25 g of distilled water was prepared in an aluminum canister and subjected to a programmed heating and cooling cycle where the sample was held at 50 ℃ for 1 min, heated to 95 ℃ at 12 ℃/min, maintained at 95 ℃ for 2.5 min, cooled to 50 ℃ at 12 ℃/min, and allowed to stand at 50 ℃ for 2 min.
Digestibility of Starch. The digestibility of starch was determined by analyzing the released reducing sugar from starch by α-amylase. The starch was mixed with sodium phosphate buffer (pH 6.9, 100 mM) and pre-heated at 37 ℃ for 10 min. The pre-heated sample solution was further mixed with α-amylase and then incubated at 37 ℃ for 2 h using a thermomixer (MS-100, ALLSHENG, China). The solution was placed into boiling water to terminate α-amylase activity, and then the solution was mixed with dinitrosalicylic acid to measure the reducing sugars as digested products by reading the absorbance value at 540 nm using a microplate reader (SpectraMax ID3, Molecular Devices, USA).
Software. All data processing and synthetic data generation/quality evaluation were performed in a Python 3.10.2 (64-bit, Windows) environment. Data preprocessing was conducted using NumPy (v1.26.4) and pandas (v1.5.2). Model-related preprocessing and analysis used scikit-learn (v1.6.1). Synthetic data generation and quality evaluation were carried out with SDV (Synthetic Data Vault, v1.30.0), using the Gaussian Copula, CTGAN, and TVAE synthesizers.

|
Figure 1 Schematic diagram of the starch digestibility prediction model and variable importance analysis. |

|
Figure 2 Presents the Overall Quality Score versus the number of synthetic samples for four synthesis methods (CTGAN, FAST ML preset, Gaussian Copula, and TVAE). Augmentation sizes of 10, 25, 50, 100, 200, 300, and 500 were evaluated. |
|
Table 1 Raw Data for the 10 Starch Samples: Independent Variables and Digestibility (Dependent Variable) |

Results. Results of Data Augmentation: To augment the data, synthetic data generation techniques—CTGAN, TVAE, Gaussian Copula, and FastML—were used to generate 200 data points each. The results of evaluating the similarity between the generated data and the original data are shown in Table 2. In all three instances of similarity evaluation, the FastML model exhibited the highest degree of similarity to the original dataset. The FastML model demonstrated a 78.41% similarity for the Column Shapes Score, a 95.57% similarity for the Column Pair Trends Score, and an overall Quality Score of 86.99%. These observations indicate that the synthetic data is effectively preserving both the distribution of the original data and the interrelationships among the variables. The high Column Pair Trends score of 95.57% is indicative of well-preserved correlations between variables.
Comparison and visual review of the original and synthetic data showed that the synthetic data aligned with the original across most variables (Figure 3).
This finding suggests that the univariate distribution was effectively preserved during the statistical data augmentation process. FastML has been adjudged to have adequately preserved the fundamental statistical characteristics of the original dataset. A high degree of distributional similarity was observed in viscosity-related parameters (Peak Viscosity, Final Viscosity, Setback Viscosity), suggesting that the rheological characteristics of the starch samples were effectively preserved in the synthetic dataset. This distributional alignment validates the synthetic data generation process, thereby justifying its use for training machine learning models. The preservation of distributional properties across all variables indicates that FastML can effectively learn and reproduce statistical patterns present in small datasets. Consequently, robust models can be developed despite a small sample size.
Performance Evaluation of Machine Learning and Neural Network Models: The results of evaluating each model's performance after hyperparameter optimization via grid search are shown in Table 3. A subsequent comparison of model performance indicated that the neural network model exhibited optimal performance metrics (R2 = 0.907, MAE = 0.044, RMSE = 0.054). The SVR model followed, with R2 = 0.902, MAE = 0.046, RMSE = 0.056, and the XGBoost model ranked third, with R2 = 0.889, MAE = 0.050, RMSE = 0.059. LightGBM demonstrated comparatively diminished performance, with an R² value of 0.867, while Random Forest attained an R2 value of 0.672. In the context of the neural network model, the model with Elastic Net regularization demonstrated optimal performance. The number of hidden units was set to 16, the batch size to 8, and the number of epochs to 400. Elastic Net regularization combines the strengths of L1 and L2 regularization, thereby mitigating overfitting on small datasets while preserving the model's expressiveness. In addition, the optimal hyperparameters for SVR, which demonstrated performance analogous to that of neural networks, were identified as regularization parameter C=10, epsilon=0.01, gamma parameter=0.001, and kernel type='rbf'. This finding indicates that nonlinear regression models employing the radial basis function (RBF) kernel are effective in predicting starch digestibility
The original dataset had a small sample size; therefore, repeated experiments were conducted on the final model to assess the variability of its performance. In this study, synthetic training data were newly generated at each of 50 repetitions, and training and evaluation were performed for each repetition. The mean and standard deviation were calculated for the performance metrics (MAE, RMSE, R2) and for the predicted values of each sample. The mean absolute error (MAE) was calculated to be 0.0440±0.0030, the root mean square error (RMSE) was calculated to be 0.0534±0.0026, and the R-squared (R²) was calculated to be 0.9092±0.0093. A scatter plot of predicted values (mean ± standard deviation [SD]) versus actual starch digestibility values is presented in Figure 4. The model demonstrated high predictive accuracy for both high-digestibility samples (wheat and rice) and low-digestibility samples (acorn and chestnut), with vertical error bars largely clustered around the 1:1 line, indicating consistent performance across the diverse digestibility range of starches.
SHAP-based Feature Importance Analysis: A SHAP analysis was conducted on the optimal Elastic Net neural network model to evaluate the relative importance of the variables that influence starch digestibility. The results are presented in Figures 5 and 6. The analysis showed that the consistency index had the greatest influence on digestibility, suggesting that starch gel strength and stability are the main determinants of digestibility outcomes.3 Setback viscosity was considered the second most significant viscosity recovery characteristic of starch during the cooling process. The third-ranked variable, peak viscosity, reflects the maximum viscosity of starch, which is directly associated with the swelling and gelatinization characteristics of starch granules during digestion. This, in turn, influences the accessibility of digestive enzymes and reaction rates.
Trough viscosity and peak time also exhibited relatively high importance, suggesting that trough viscosity and time to reach peak viscosity contribute to digestibility prediction. A-chain and amylose content exhibited moderate importance, as higher amylose content increases resistance to digestion.2 The B1 chain, final viscosity, and breakdown viscosity exhibited relatively low importance, as shown in Figure 5. These findings suggest that rheological properties, particularly consistency index and setback viscosity, are the most important for predicting digestibility.
Given the established correlation between these major SHAP variables and viscosity–rheology, an assessment of inter-variable multicollinearity was deemed necessary. Variables suspected of collinearity, such as A chain and B1 chain, exhibited relatively low SHAP importance and were thus judged not to substantially affect the interpretation of variable importance. Furthermore, the Elastic Net regularization applied to the final model mitigates the impact of multicollinearity on SHAP-based interpretation.
Discussion. Data Augmentation Strategy and Effectiveness: This study systematically compared and evaluated statistical modeling-based data augmentation techniques to overcome the limitations of small datasets (n=10). Among the four evaluated techniques (FastML Preset, Gaussian Copula, TVAE, CTGAN), FastML Preset achieved the highest similarity (Quality Score: 86.99%). Notably, the Column Pair Trends Score (95.57%) was high, indicating excellent preservation of inter-variable correlations. As shown in Figure 3, the distributions of the original and synthetic data exhibited high similarity across most variables.
Evaluation of Model Performance and Algorithmic Characteristics: Comparative evaluation of the performance of starch digestibility prediction models demonstrated that the neural network model achieved superior performance (R2 = 0.907, MAE = 0.044, RMSE = 0.054), followed by the support vector regression (SVR) model (R2 = 0.902, MAE = 0.046, RMSE = 0.056) and the extreme gradient boosting (XGBoost) model (R2 = 0.889, MAE = 0.050, RMSE = 0.059). The best performance of the neural network model stems from Elastic Net regularization, which mitigates overfitting, and from its capacity to capture nonlinear relationships in small datasets.16 Elastic Net regularization effectively alleviates overfitting in small datasets by combining the sparsity induction of L1 regularization with the weight stabilization effect of L2 regularization. The competitive performance of SVR stems from its nonlinear mapping capability via the RBF kernel.13 Conversely, XGBoost and LightGBM, being boosting-based ensemble models, exhibited comparatively lower performance relative to the neural network model.
Feature Importance and Biological Interpretation: SHAP analysis demonstrated that the consistency index exerted the greatest influence on digestibility. This was followed by setback viscosity and peak viscosity. These were the second and third most important variables, respectively. Trough viscosity and peak time also exhibited relatively high importance, while A chain and amylose content demonstrated moderate importance. The B1 chain, final viscosity, and breakdown viscosity exhibited relatively low importance. These results indicate that rheological properties, particularly the consistency index and setback viscosity, are the most critical for predicting digestibility. This implies that structural stability and viscosity recovery characteristics play a pivotal role in digestive processes.
The presence of multicollinearity among the variables was suspected. The primary SHAP variables (consistency index, setback viscosity, and peak viscosity) are associated with viscosity and rheology, and they may exhibit interrelations. Additionally, correlations may be present among the A chain, B1 chain, and the viscosity parameters. However, the machine learning models employed in this study (Random Forest, SVR, XGBoost, LightGBM, Neural Network) exhibit greater resilience to multicollinearity compared to linear regression. The neural network with Elastic Net regularization mitigates coefficient instability via L1/L2 penalties. While certain variables exhibited elevated SHAP importance, others demonstrated minimal importance. Consequently, the impact on interpretation bias is deemed negligible, and SHAP-based variable importance appears to be interpretable without significant concern.
Methodological Contributions and Practical Implications: The methodological contribution of this study consists of the systematic comparative assessment of data augmentation techniques on a small-scale food dataset, the construction of an optimized machine learning model training pipeline, and the implementation of variable importance analysis. Notably, the data augmentation methodology can be employed in future similar investigations. From an applied perspective, this study offers a cost-efficient approach for predicting starch digestibility in the food industry. In contrast, the model developed in this study can predict digestibility with high accuracy using the physicochemical properties of starch exclusively, making it applicable for use in the preliminary experimental phases.
Limitations and Future Directions: This work is subject to the following limitations. Firstly, the small sample size (n = 10) limits the capacity for thorough evaluation of generalization performance. The absence of an external validation dataset hindered the assessment of external validity. Subsequent research endeavors should employ a range of starch datasets to ascertain the model's capacity for generalization. Secondly, certain generative adversarial network-based data augmentation techniques, such as CTGAN, were excluded due to training instability on small datasets, thus preventing a comprehensive comparison of recent data augmentation methods. For future work, one may consider comparative evaluation with advanced generative models (e.g., TabDDPM, CTAB-GAN).19,20 is warranted. Thirdly, this study did not take into account starch thermal characteristic variables. In order to analyze the impact of thermal characteristic variables on digestibility, future analyses incorporating these relevant variables should be considered.

|
Figure 3 Presents a comprehensive comparison of univariate distributions between the original dataset (n=10) and the synthetically augmented dataset (n=200) generated using FastML. |

|
Figure 4 Pred icted vs. actual digestibility for the neural network (Elastic Net) model. Each point represents the mean predicted value across 50 repeats, with vertical error bars indicating the standard deviation. The dashed red line represents the 1:1 line. Model performance: MAE = 0.0440 ± 0.0030, RMSE = 0.0534 ± 0.0026, R2 = 0.9092 ± 0.0093 (mean ± SD, repeat=50). |

|
Figure 5 SHAP summary plot illustrating feature contributions in the optimal model (neural network with Elastic Net regularization). |

|
Figure 6 Mean absolute SHAP values representing feature importance rankings for starch digestibility prediction. |

|
Table 3 Model Performance Metrics and Optimal Hyperparameters for Starch Digestibility Prediction |

This study used data augmentation techniques on a small dataset to predict starch digestibility and analyze variable importance. A neural network model that was trained using synthetic data, which was generated with the FAST ML preset, demonstrated superior performance. SHAP analysis confirmed that the consistency index, setback viscosity, and peak viscosity are the most important variables for predicting digestibility. Furthermore, the rheological properties of starch, particularly its consistency and viscosity recovery characteristics, were identified as critical factors in the digestion process. Finally, digestibility can be accurately predicted using only the physicochemical properties of starch, suggesting its potential as an alternative to conventional in vitro digestion experiments in the food industry.
- 1. Englyst, H. N.; Kingman, S. M.; Cummings, J. H. Classification and Measurement of Nutritionally Important Starch Fractions. Eur. J. Clin. Nutr. 1992, 46, S33-S50.
- 2. Tester, R. F.; Karkalas, J.; Qi, X. Starch—composition, Fine Structure and Architecture. J. Cereal Sci. 2004, 39, 151-165.
-

- 3. Singh, N.; Singh, J.; Kaur, L.; Sodhi, N. S.; Gill, B. S. Morphological, Thermal and Rheological Properties of Starches from Different Botanical Sources. Food Chem. 2003, 81, 219-231.
-
- 4. Jenkins, D. J.; Wolever, T. M.; Taylor, R. H.; Barker, H.; Fielden, H.; Baldwin, J. M.; Bowling, A. C.; Newman, H. C.; Jenkins, A. L.; Goff, D. V. Glycemic Index of Foods: a Physiological Basis for Carbohydrate Exchange. Am. J. Clin. Nutr. 1981, 34, 362-366.
-
- 5. Sajilata, M. G.; Singhal, R. S.; Kulkarni, P. R. Resistant Starch—a Review. Compr. Rev. Food Sci. Food Saf. 2006, 5, 1-17.
-
- 6. Englyst, H. N.; Cummings, J. H. Digestion of the Polysaccharides of Some Cereal Foods in the Human Small Intestine. Am. J. Clin. Nutr. 1985, 42, 778-787.
-
- 7. Chen, L.; Zhang, H.; Liu, Q.; Pang, L. Application of Machine Learning in Food Science. Compr. Rev. Food Sci. Food Saf. 2020, 19, 2019-2035.
- 8. Ropodi, A. I.; Panagou, E. Z.; Nychas, G. J. Data Mining Derived From Food Analyses Using Non-invasive/non-destructive Analytical Techniques; Determination of Food Authenticity, Quality & Safety in Tandem with Computer Science Disciplines. Trends Food Sci. Technol. 2016, 50, 11-25.
-
- 9. Hastie, T.; Tibshirani, R.; Friedman, J. The Elements of Statistical Learning: Data Mining, Inference, and Prediction, 2nd ed.; Springer: New York, 2009.
-
- 10. Shorten, C.; Khoshgoftaar, T. M. A Survey on Image Data Augmentation for Deep Learning. J. Big Data 2019, 6, 60.
-
- 11. Patki, N.; Wedge, R.; Veeramachaneni, K. The Synthetic Data Vault. In Proceedings of the 2016 IEEE International Conference on Data Science and Advanced Analytics (DSAA), Montreal, QC, Canada, 17-19 October 2016; pp 399-410.
-
- 12. Breiman, L. Random Forests. Mach. Learn. 2001, 45, 5-32.
-
- 13. Smola, A. J.; Schölkopf, B. A Tutorial on Support Vector Regression. Stat. Comput. 2004, 14, 199-222.
-
- 14. Chen, T.; Guestrin, C. XGBoost: A Scalable Tree Boosting System. In Proceedings of the 22nd ACM SIGKDD International Conference on Knowledge Discovery and Data Mining; ACM: New York, 2016; pp 785-794.
-
- 15. Ke, G.; Meng, Q.; Finley, T.; Wang, T.; Chen, W.; Ma, W.; Ye, Q.; Liu, T.-Y. LightGBM: A Highly Efficient Gradient Boosting Decision Tree. In Advances in Neural Information Processing Systems 30 (NeurIPS 2017); Curran Associates: Red Hook, NY, 2017; pp 3146-3154.
- 16. Zou, H.; Hastie, T. Regularization and Variable Selection via the Elastic Net. J. R. Stat. Soc. Ser. B (Stat. Methodol.) 2005, 67, 301-320.
-
- 17. Lundberg, S. M.; Lee, S.-I. A Unified Approach to Interpreting Model Predictions. In Advances in Neural Information Processing Systems 30 (NeurIPS 2017); Curran Associates: Red Hook, 2017; pp 4765-4774.
- 18. Lundberg, S. M.; Erion, G. G.; Lee, S.-I. Consistent Individualized Feature Attribution for Tree Ensembles. arXiv 2018, DOI:10.48550/arXiv.1802. 03888.
-
- 19. Kotelnikov, A.; Baranchuk, D.; Rubachev, I.; Babenko, A. TabDDPM: Modelling Tabular Data with Diffusion Models. In Proceedings of the 40th International Conference on Machine Learning, Honolulu, 23-29 July 2023; pp 17564-17579.
- 20. Zhao, Z.; Kunar, A.; Birke, R.; Van der Scheer, H.; Chen, L. Y. CTAB-GAN+:enhancing tabular data synthesis. Front. Big Data 2024, 6, 1296508.
-

- Polymer(Korea) 폴리머
- Frequency : Bimonthly(odd)
ISSN 2234-8077(Online)
Abbr. Polym. Korea - 2025 Impact Factor : 1.0
- Indexed in SCIE
 This Article
-
2026; 50(3): 467-476
Published online May 25, 2026
- 10.7317/pk.2026.50.3.467
- Received on Jan 19, 2026
- Revised on Feb 12, 2026
- Accepted on Feb 14, 2026
Services
- Full Text PDF
- Abstract
- ToC
- Acknowledgements
- Conflict of Interest
Introduction
Experimental
Results and Discussion
Conclusions
- References
Shared
Correspondence to
- Jongbin Lim*, *******, Yun Am Seo**
-
*Department of Food Bioengineering, Jeju National University, Jeju 63243, Korea
**Department of Data Science, Jeju National University, Jeju-si, 63243, Korea
*******Interdisciplinary Graduate Program in Advance Convergence Technology and Science, Jeju National University, Jeju 63243, Korea - E-mail: jongbinlim@jejunu.ac.kr, seoya@jejunu.ac.kr
- ORCID:
0009-0005-4764-0085, 0000-0001-9283-4376
Hyecheon Building(Room 601), #354, Gangnam-Daero, Gangnam-Gu, Seoul 06242, Korea
TEL : 82-2-568-3860, 561-5203, 569-3860 FAX : 82-2553-6938 E-mail: polymer@polymer.or.kr